Lively Logic
Developed by James Rodovich
You can add a filter to control which entries from your dataset will be displayed in a chart or series. You can use filters to segment your dataset or highlight important values.
To add a filter, first select your chart. If it’s a table or a category graph, you’ll see the Filter  button next to the Dataset pop-up menu in the inspector bar. If it’s an X-Y graph, each series can use a different dataset, so you’ll find the button in the panels for configuring series. For more about charts and the inspector bar, see the “Customizing charts” guide.
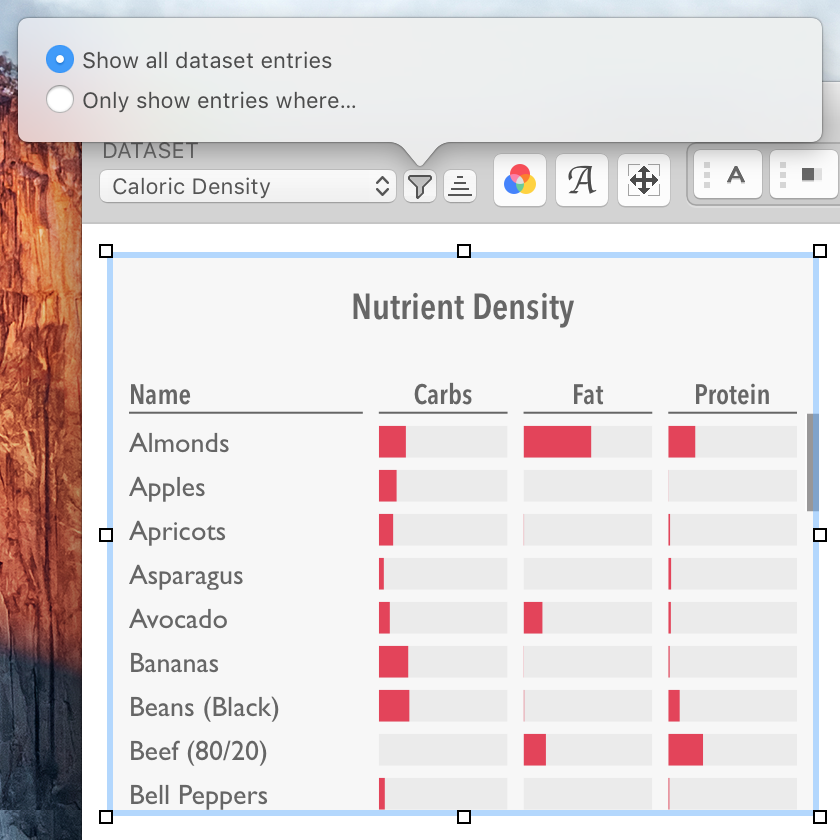
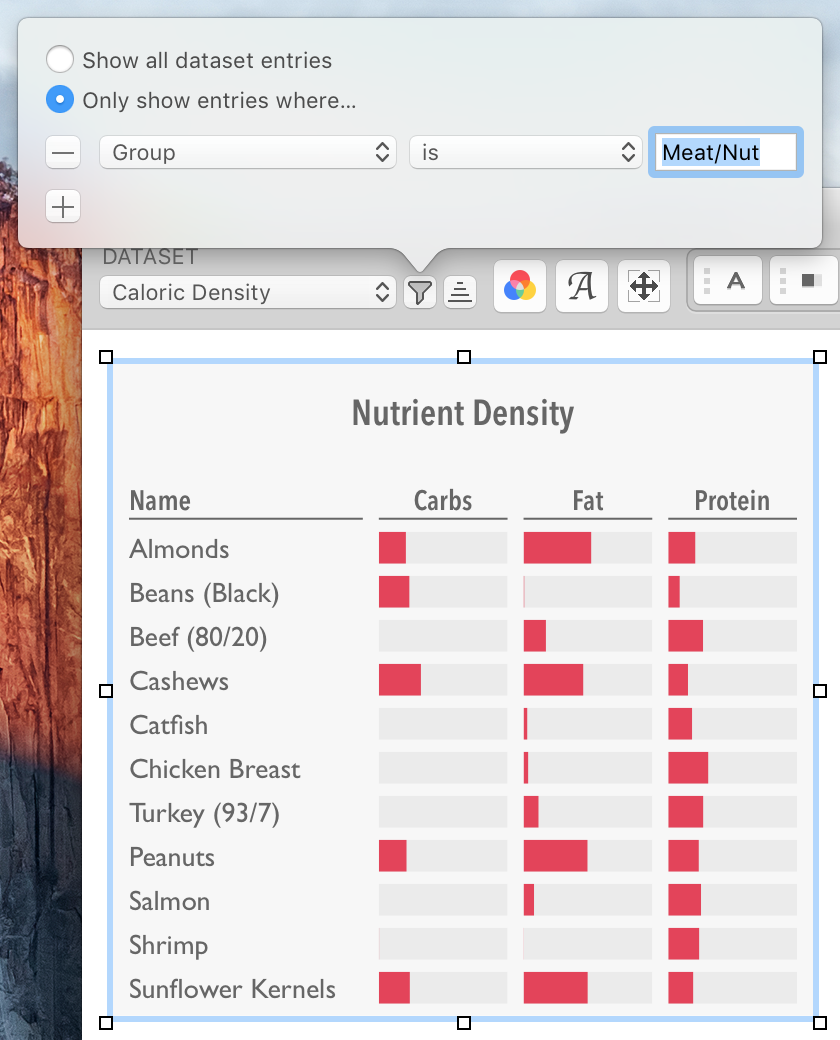
Click the Filter button to open the filter panel. Choose Only show entries where… and pick a dataset field and a condition. The condition will be tested for every value in that field, and only dataset entries that meet the condition will be displayed in the chart or series.
For tables and category graphs, the filter applies to the whole chart. For X-Y graph series, each series can have different filters.
You can add multiple conditions by clicking the + button in the filter panel. With multiple conditions, only dataset entries that meet all conditions will be displayed. To remove a condition, click the − button. To disable a filter altogether, remove every condition or choose Show all dataset entries.
Filters can be especially useful in X-Y graphs, since each series can have different filters. You can add multiple series with different filters to label certain values or to highlight a specific subset of the data.
For example, you could display all the dataset’s values in a line graph series, and use a filter on a text series to add labels to the outliers.
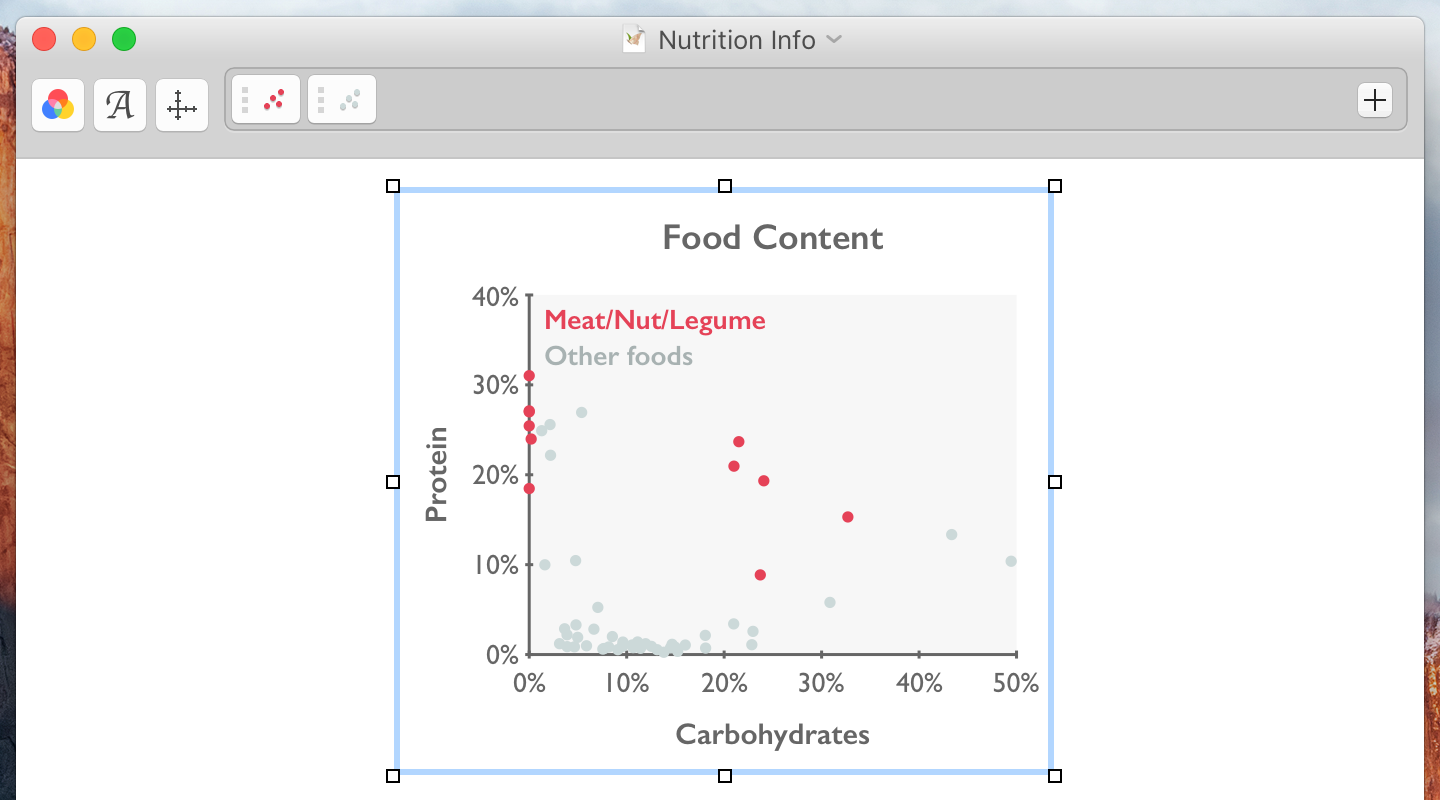
Or you could color-code a scatterplot by adding a series for each color, each with a different filter to show a different subset of the data. In the image below, the scatterplot has two series, both using the same dataset and the same fields for the X and Y values. However, the red series has a filter applied to draw attention to a specific segment of the data.
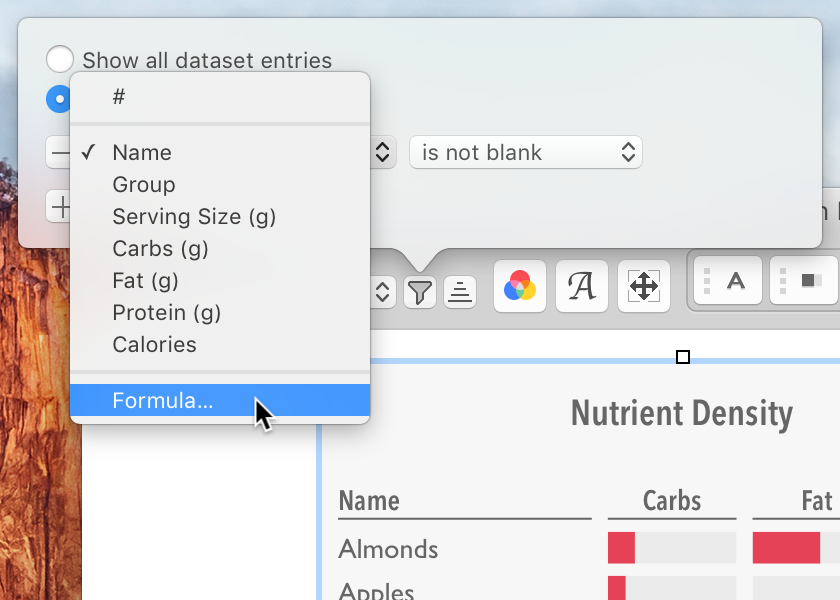
When setting a filter condition, you can choose to test the condition against the result of a formula, instead of against the values of a dataset field. This lets you achieve more complex effects than you could by testing against a dataset field directly. To filter with a formula, choose Formula… instead of a dataset field, and enter a formula. For example, the following formula returns a number for each entry representing the difference, measured in standard deviations, between the entry’s Weight value and the mean:
ABS($"Weight" - AVERAGE($"Weight")) / STD($"Weight")
By using this formula with a filter condition, you could highlight values where the difference was greater than a particular number of standard deviations.
For more about formulas, see the “Writing formulas” guide.
![]() © 2012–2026 James Rodovich.
All rights reserved.
© 2012–2026 James Rodovich.
All rights reserved.